8.4 The time-of-flight spectrometer PRISMA
In order to test the time-of-flight aspect of McStas, we have in collaboration with Mark Hagen, now at SNS, written a simple simulation of a time-of-flight instrument loosely based on the ISIS spectrometer PRISMA. The simulation was used to investigate the effect of using a RITA-style analyser instead of the normal PRISMA backend. The instrument is distributed as ISIS/ISIS_Prisma2 in the example library.
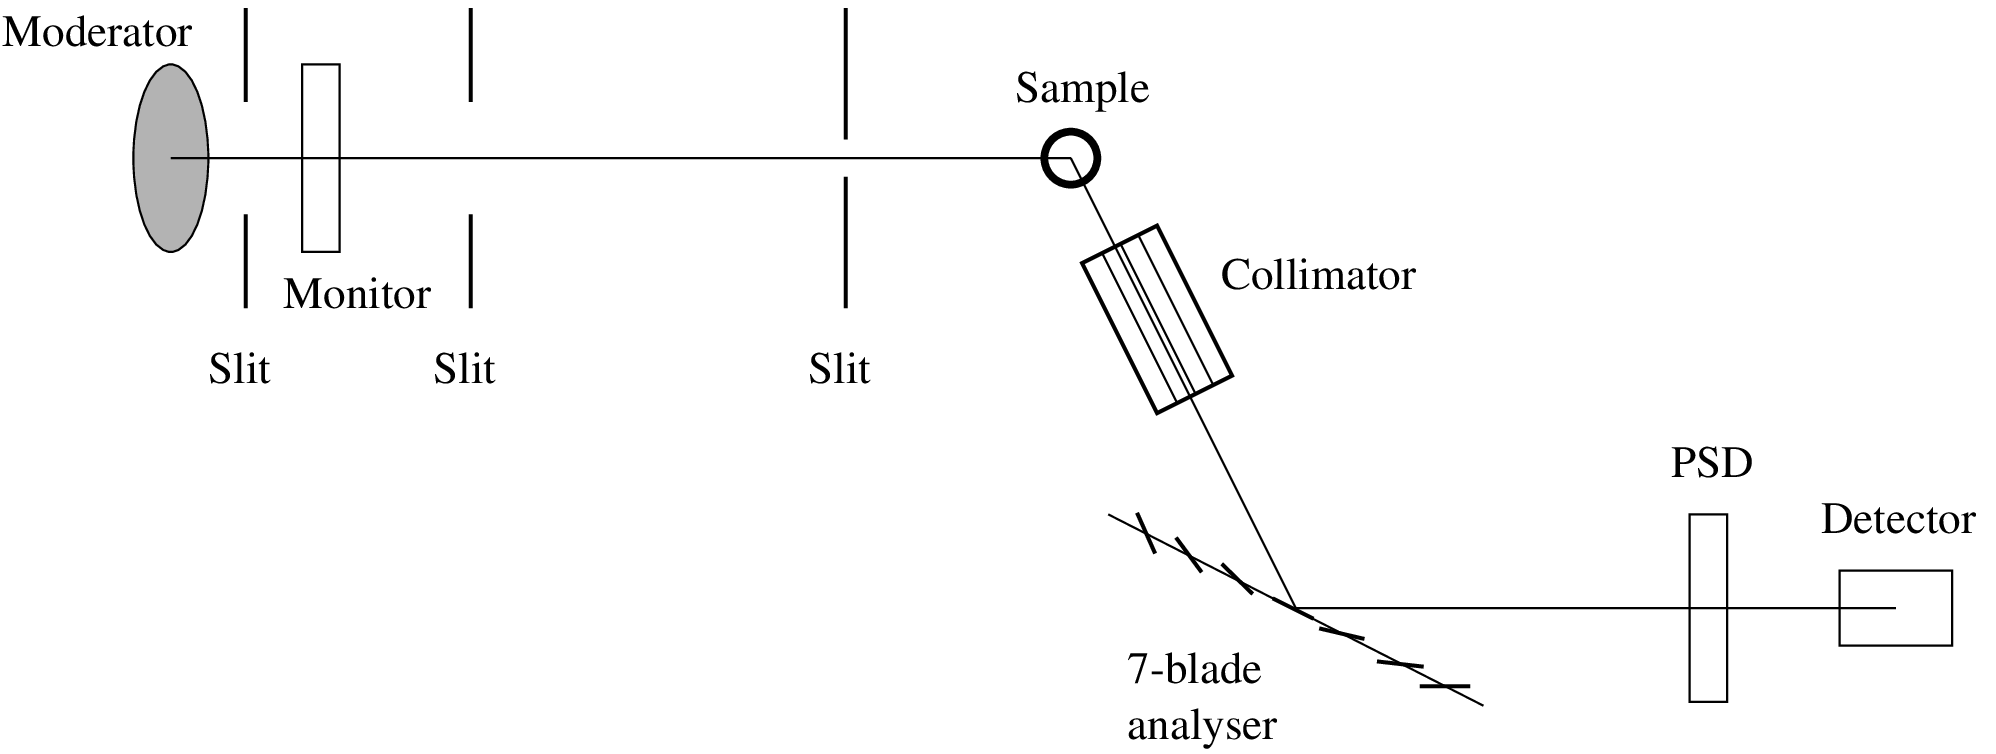
We have used the simple time-of-flight source Tof_source. The neutrons pass through a beam channel and scatter off from a vanadium sample, pass through a collimator on to the analyser. The RITA-style analyser consists of seven analyser crystals that can be rotated independently around a vertical axis. After the analysers we have placed a PSD and a time-of-flight detector.
To illustrate some of the things that can be done in a simulation as opposed to a real-life experiment, this example instrument further discriminates between the scattering off each individual analyser crystal when the neutron hits the detector. The analyser component is modified so that a global variable neu_color registers which crystal scatters the neutron ray. The detector component is then modified to construct seven different time-of-flight histograms, one for each crystal (see the source code for the instrument for details). One way to think of this is that the analyser blades paint a color on each neutron which is then observed in the detector. Since McStas 3.x, the same effect could alternatively be achieved more simply using a USERVARS field (section 4.3.6) rather than a global DECLARE variable, which additionally makes the technique safe under SPLIT/GPU execution. An illustration of the instrument is shown in figure 8.8. Test results are shown in Appendix 8.4.1.
8.4.1 Simple spectra from the PRISMA instrument
A plot from the detector in the PRISMA simulation is shown in Figure 8.9. These results were obtained with each analyser blade rotated one degree relative to the previous one. The separation of the spectra of the different analyser blades is caused by different energy of scattered neutrons and different flight path length from source to detector. We have not performed any quantitative analysis of the data.
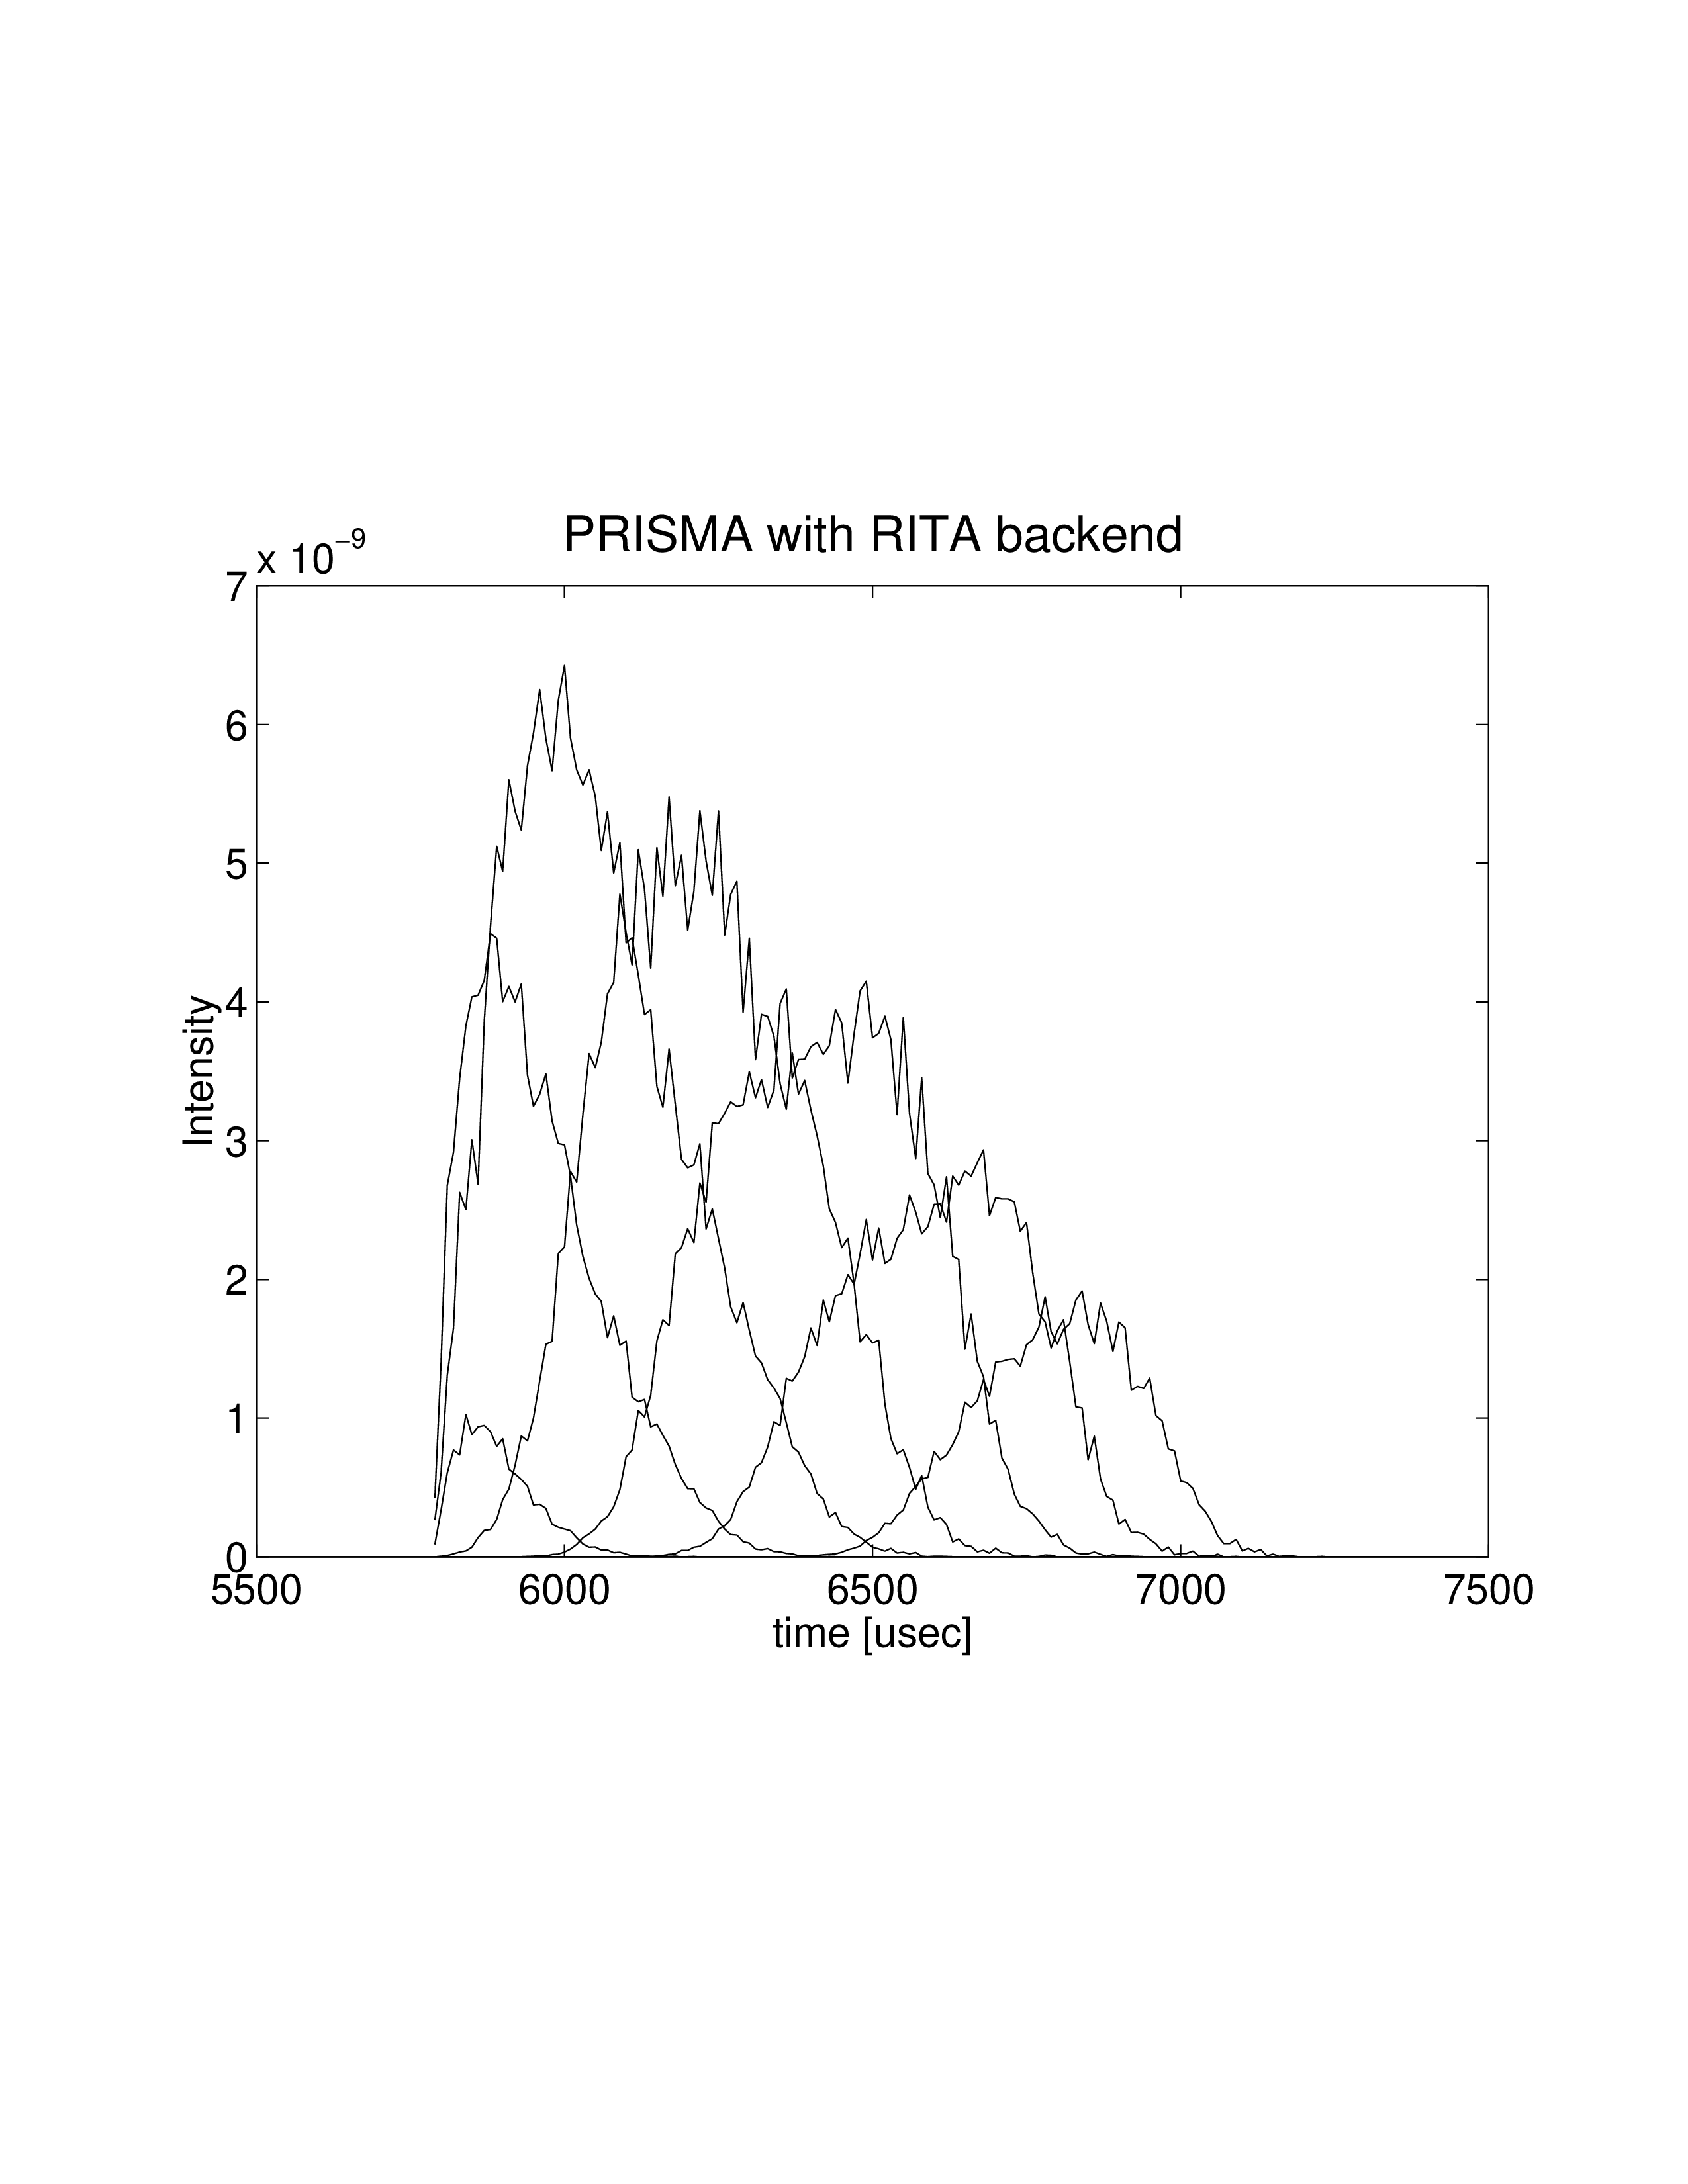
| Figure 8.9.: | Test result from PRISMA instrument using “colored neutrons”. Each graph shows the neutrons scattered from one analyser blade. |